Distributed Tracing with Zipkin
Distributed tracing is a key diagnostics tool in your microservices toolbelt. Distributed traces show you at a glance what operations took place across your entire application to complete some task.
Zipkin is a popular open-source distributed trace storage and query system. It can show you:
- Which services were involved with an end-to-end operation?
- What are the trace IDs to reference logs for an operation?
- What were the timings of work done in each service for an operation?
Tye can get distributed tracing working easily without adding any SDKs or libraries to your services.
Getting Started: Enabling WC3 tracing
The first step is to enable the W3C trace format in your .NET applications. This is mandatory, you won't get traces without doing this!
💡 If you want an existing sample to run, the sample here will do. This sample code already initializes the trace format.
You need to place the following statement somewhere early in your program:
Activity.DefaultIdFormat = ActivityIdFormat.W3C;Here's what it would look like for a typical ASP.NET Core application in Program.cs (recommended).
using System.Diagnostics;
using Microsoft.AspNetCore.Hosting;
using Microsoft.Extensions.Hosting;

namespace Frontend
{
    public class Program
    {
        public static void Main(string[] args)
        {
            Activity.DefaultIdFormat = ActivityIdFormat.W3C;
            CreateHostBuilder(args).Build().Run();
        }

        public static IHostBuilder CreateHostBuilder(string[] args) =>
            Host.CreateDefaultBuilder(args)
                .ConfigureWebHostDefaults(webBuilder =>
                {
                    webBuilder.UseStartup<Startup>();
                });
    }
}
Enabling Zipkin in tye.yaml
The next step is to add the zipkin extension to your tye.yaml. Add the extensions node and its children from the example below.
name: frontend-backend

extensions:
- name: zipkin

services:
- name: backend
  project: backend/backend.csproj
- name: frontend
  project: frontend/frontend.csproj
Running locally with zipkin
That's all the required configuration. Next, launch the application with tye run.
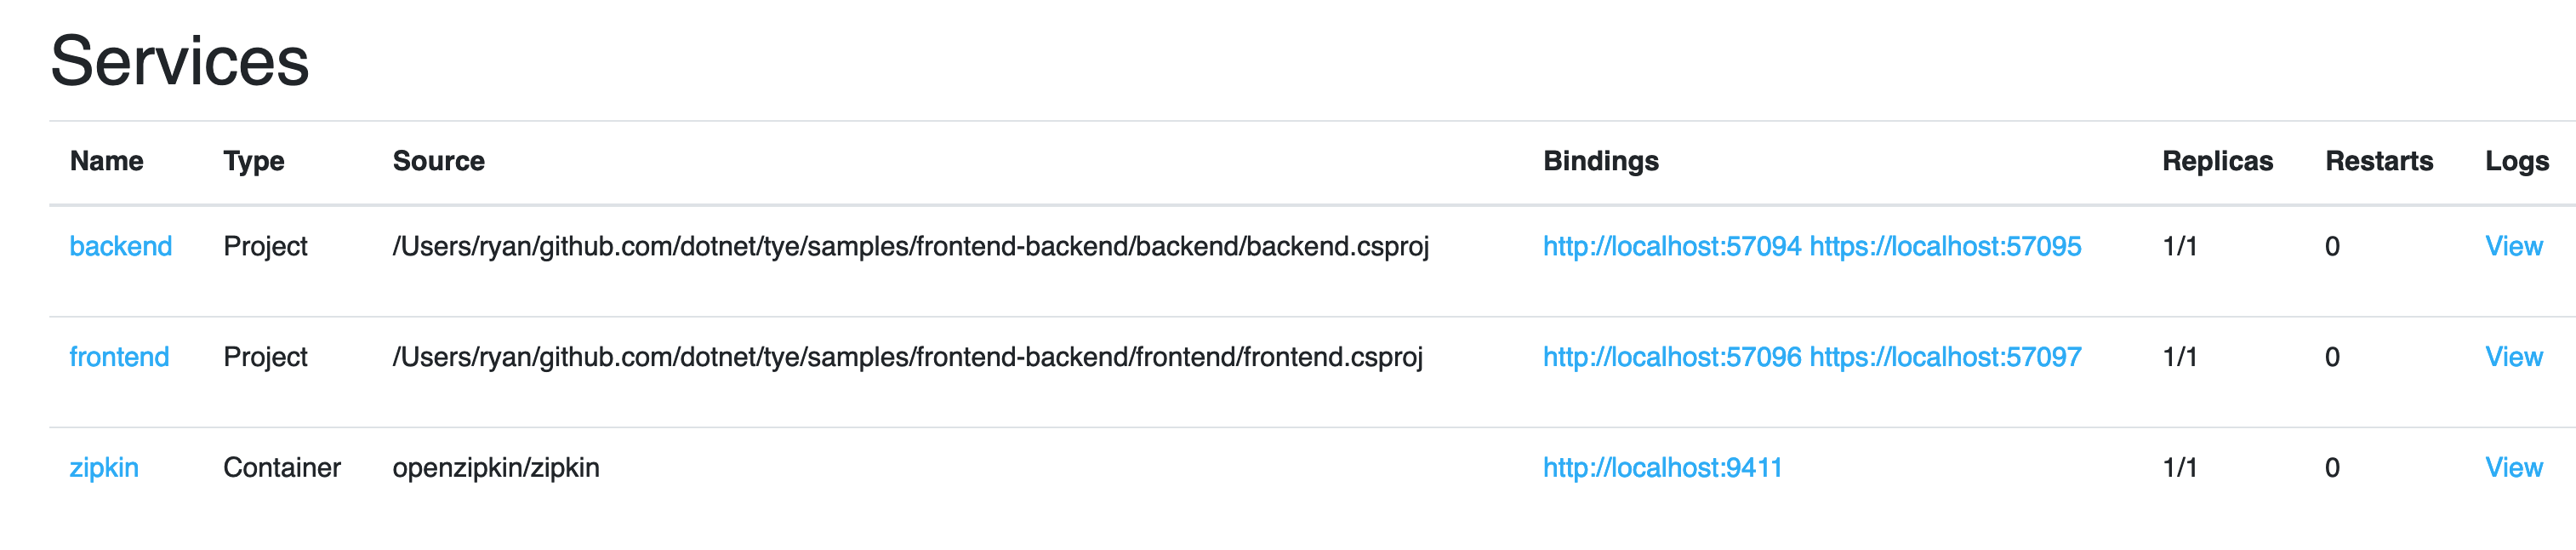
The dashboard should show that you've got a zipkin service running.
Visit the frontend service (or send some traffic to your services if you are using your own code). This will populate some data in the zipkin instance.
Then visit the zipkin dashboard by clicking the link. Tye will use a fixed address of http://localhost:9411 which is typically used by zipkin.
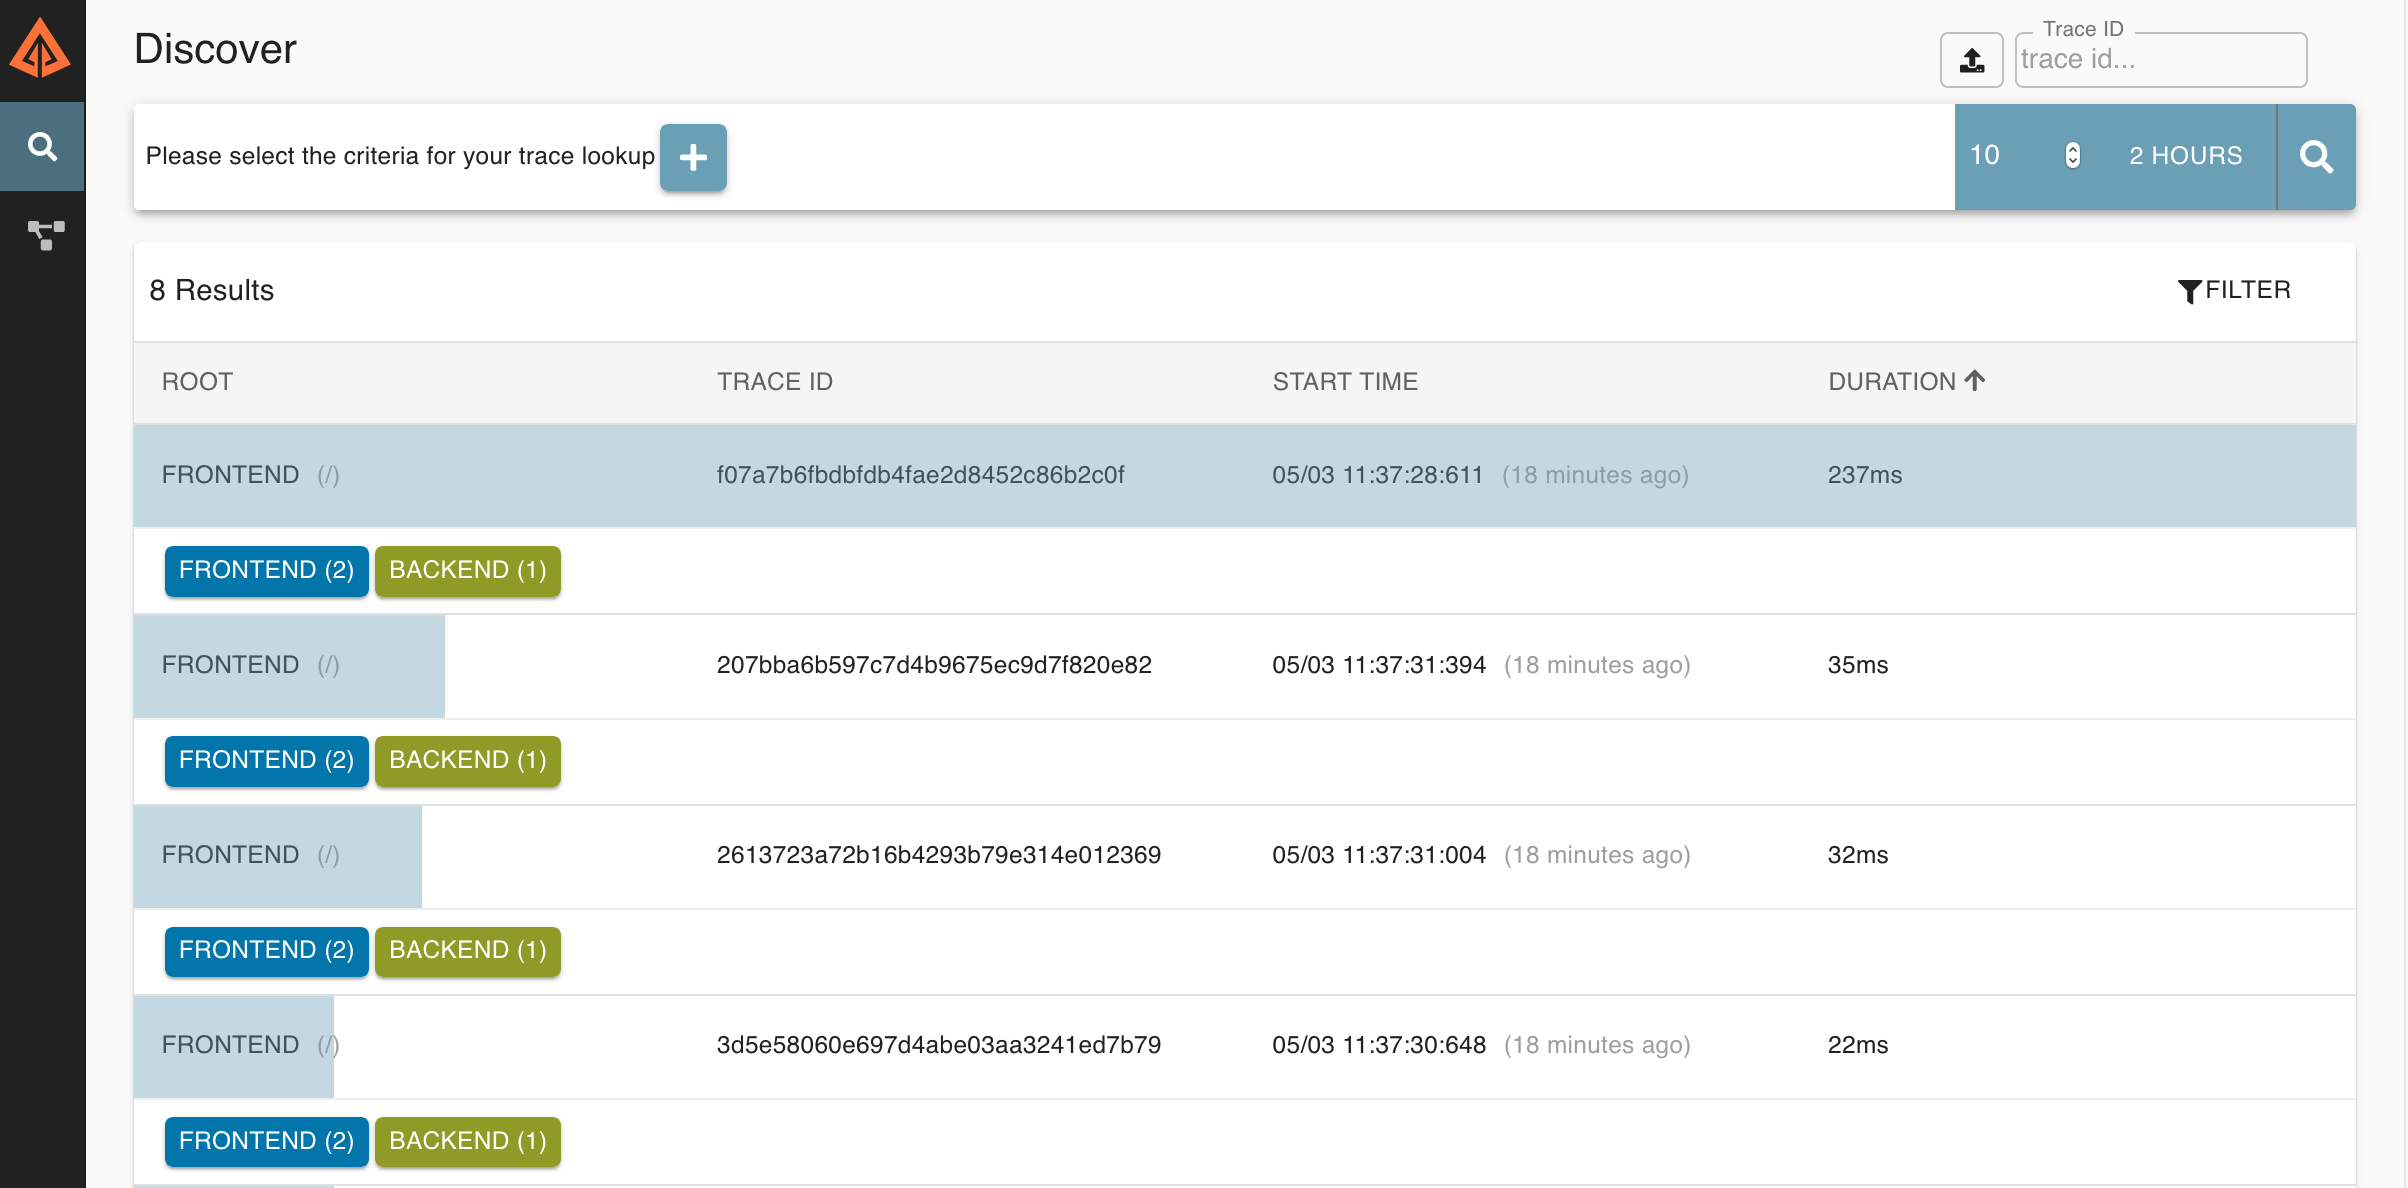
You won't see anything at first... because you need to do a search.
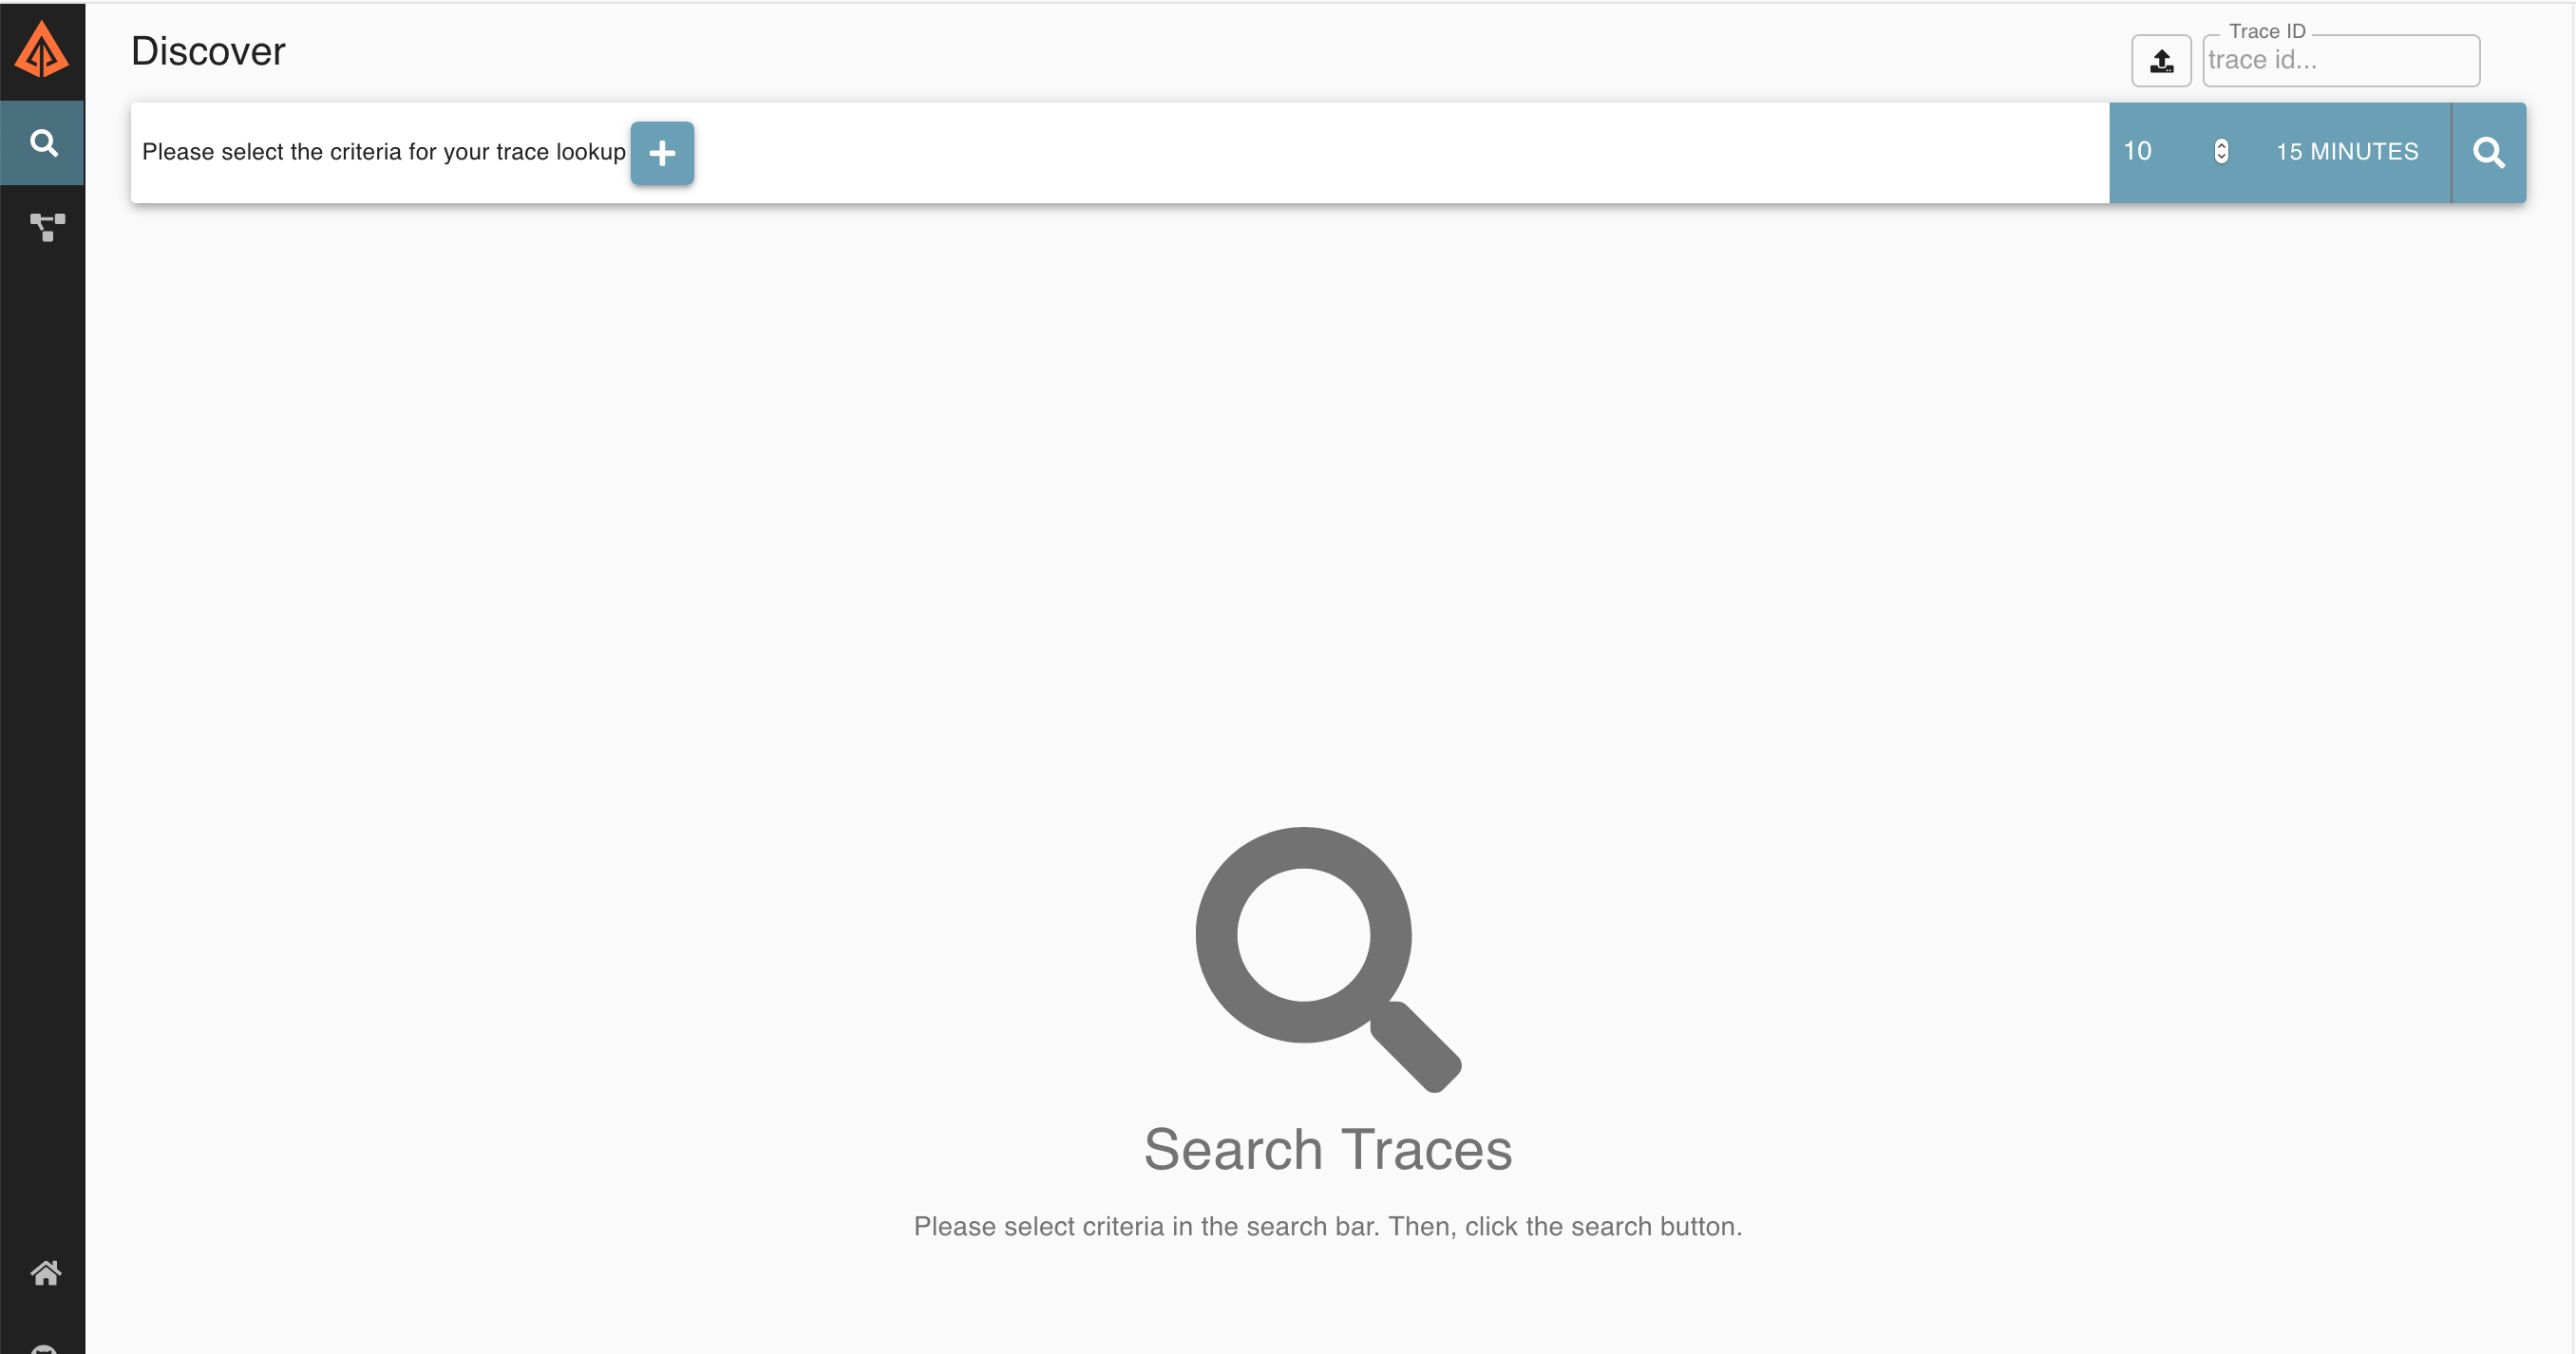
Click the magnifying glass icon (on the right) to do a search.
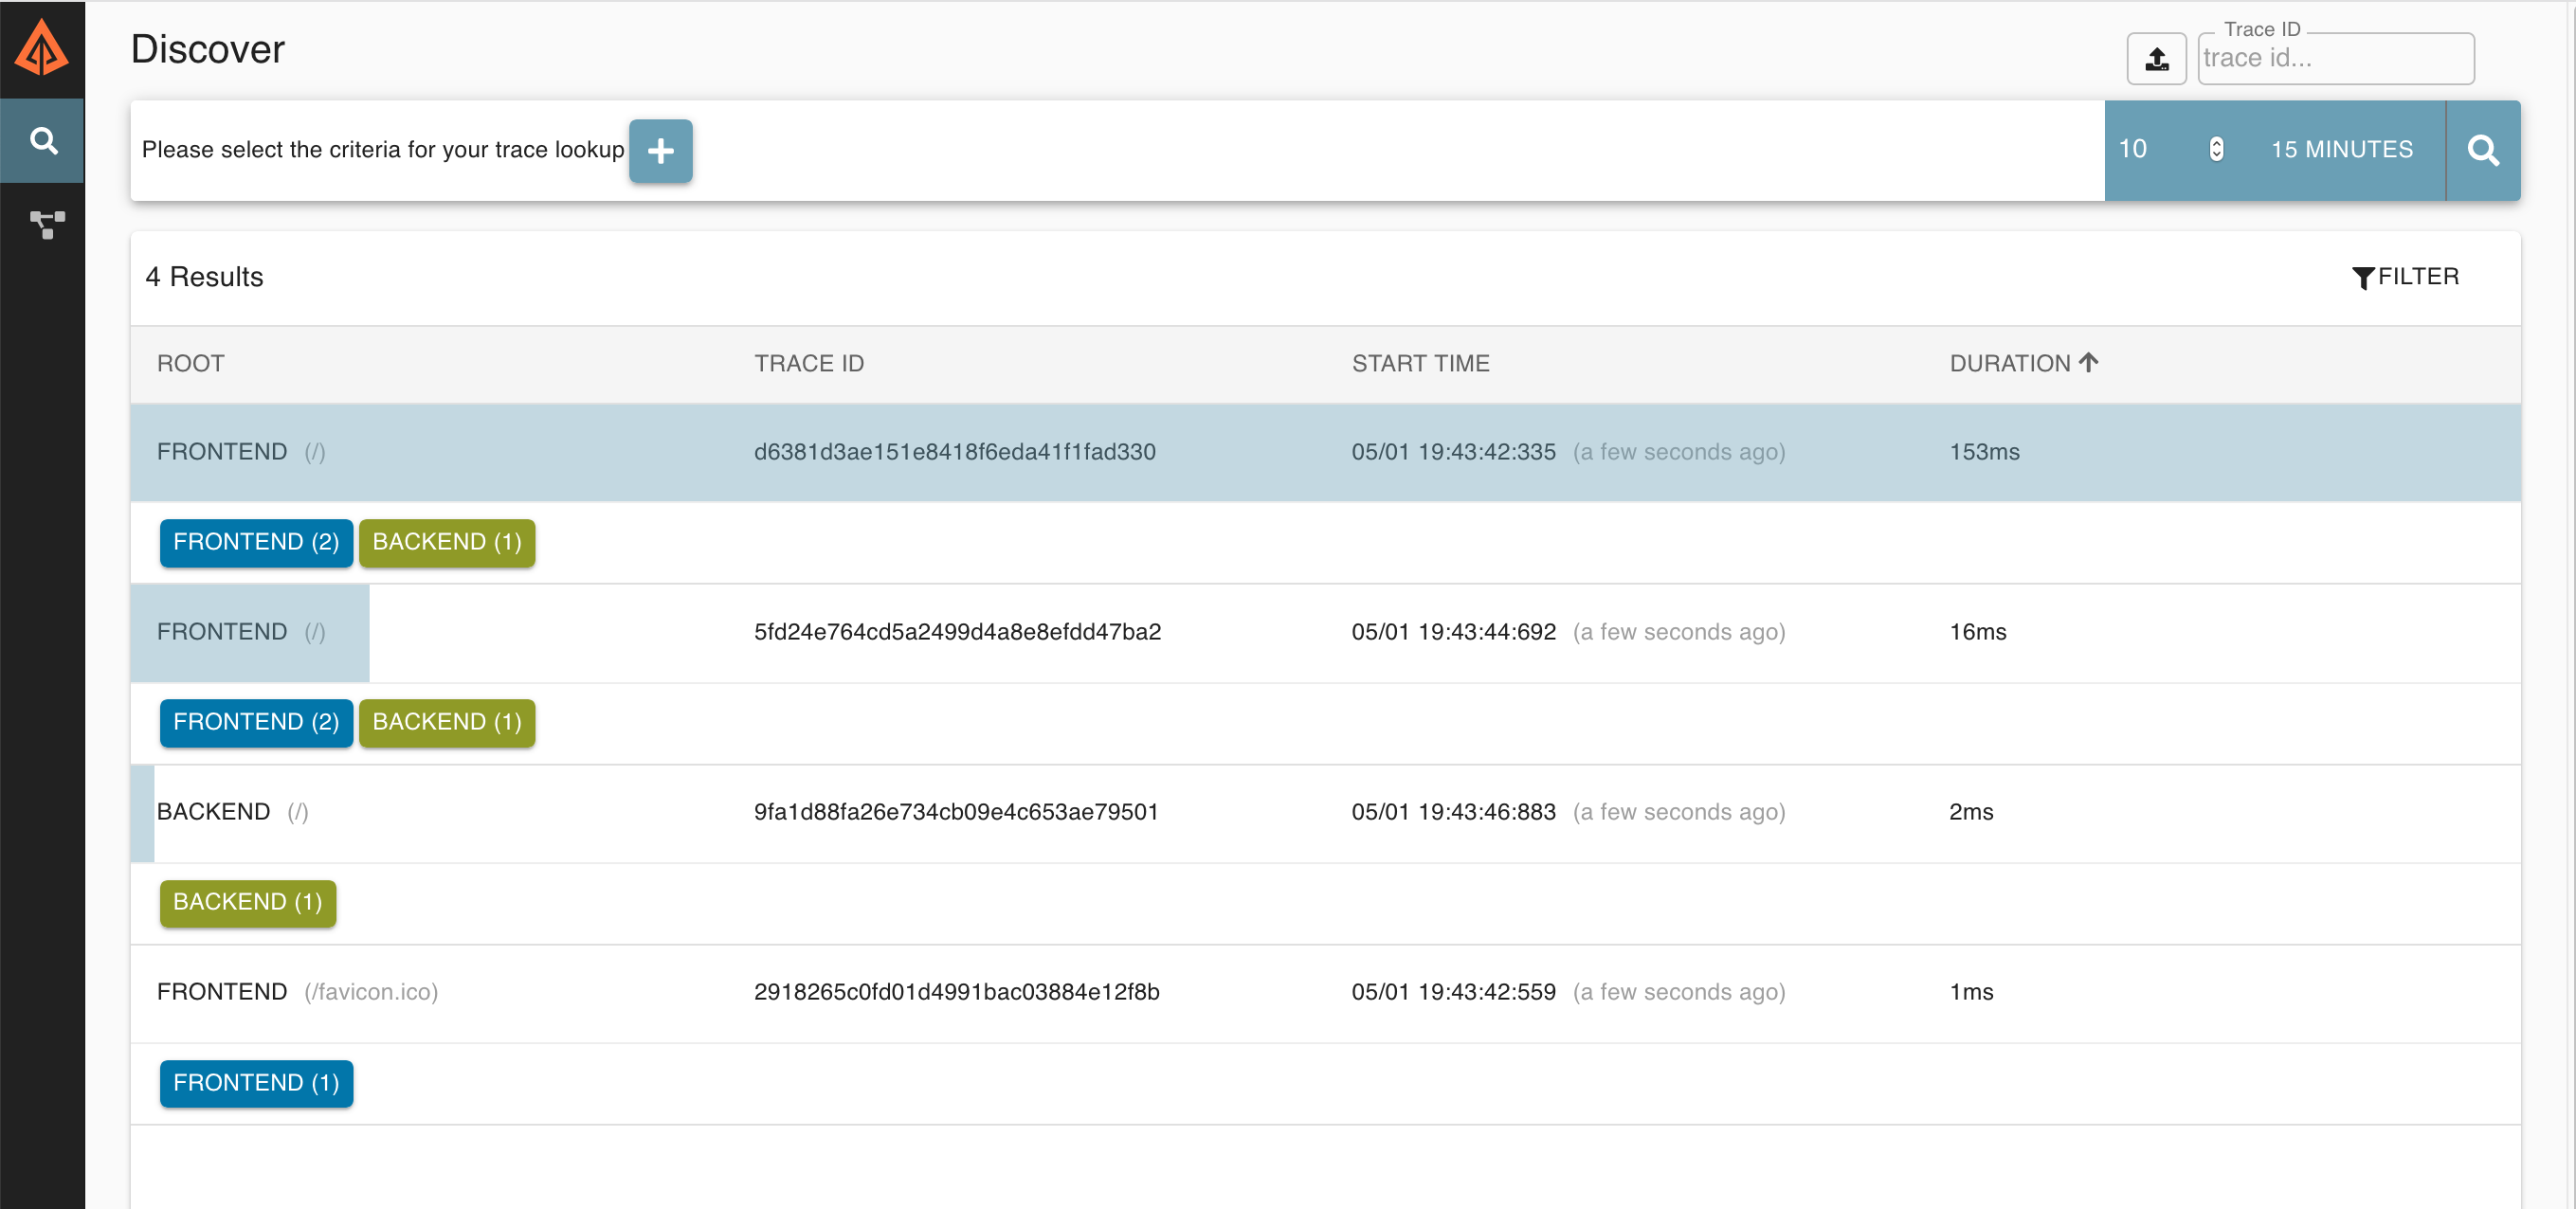
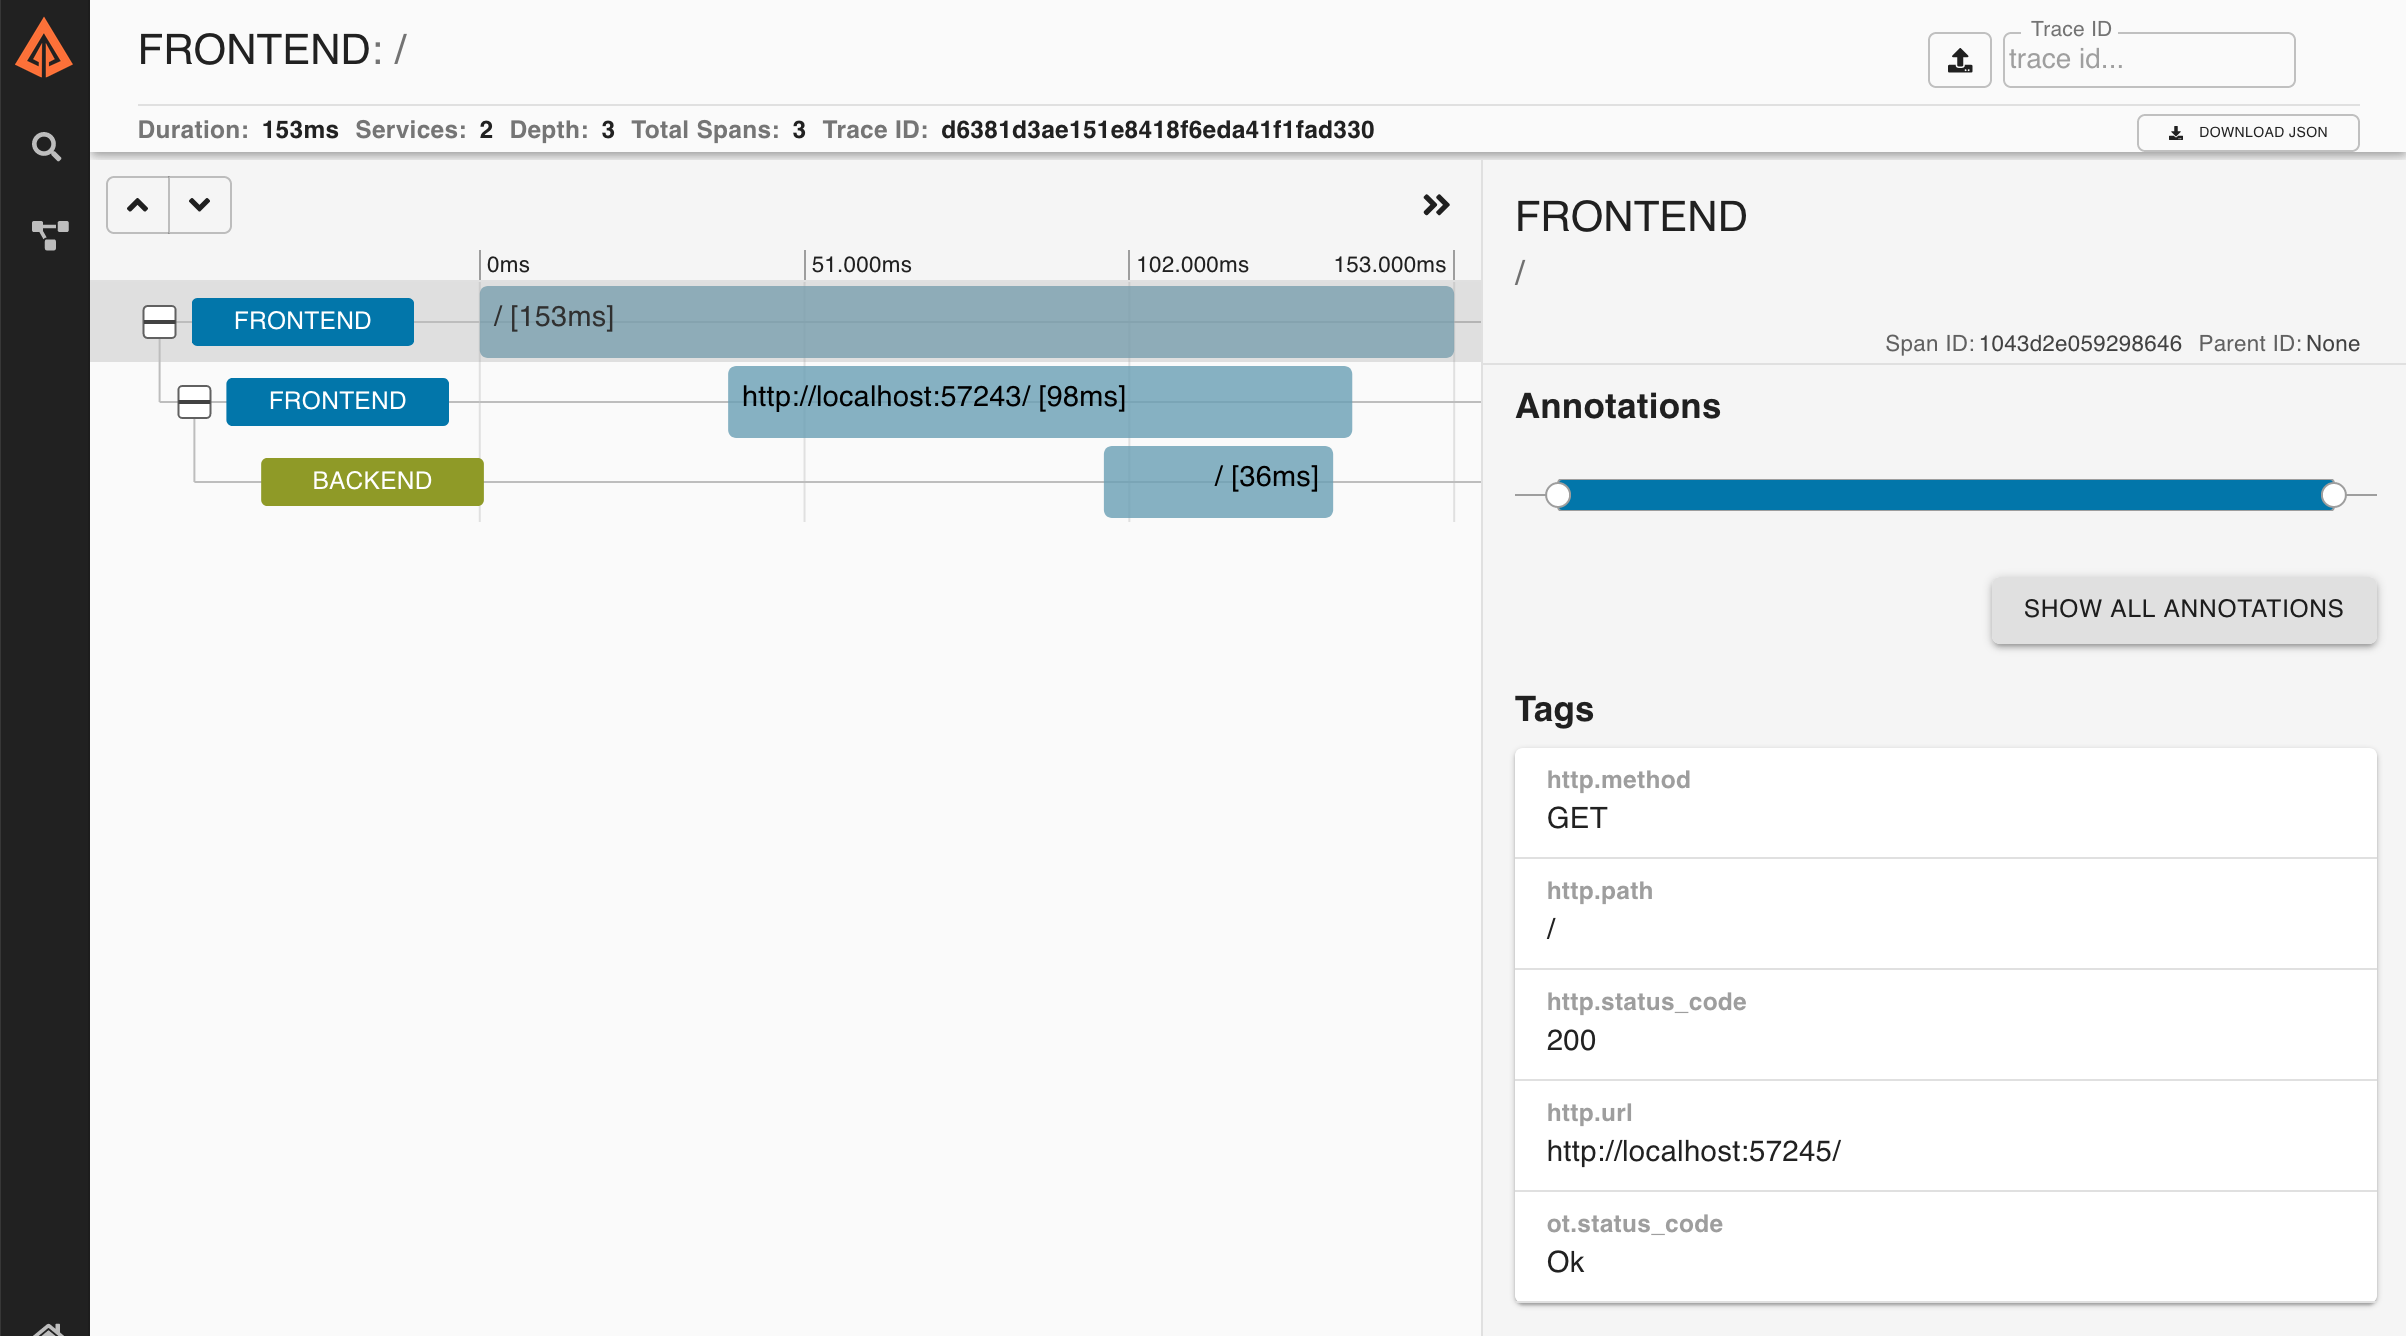
Clicking on one of these traces can show you a breakdown of how time was spent, what URIs were accessed, status codes, etc.
Deploying an application with zipkin
To use zipkin for distributed tracing in a deployed application, we first need to deploy zipkin to the cluster.
Run the following to deploy a minimal zipkin configuration:
kubectl apply -f https://raw.githubusercontent.com/dotnet/tye/main/docs/recipes/zipkin.yaml⚠️ This is the most basic possible deployment of zipkin. There's no data persistence here!
This will create a zipkin service and deployment in your current Kubernetes context.
You can verify that it's started using kubectl:
> kubectl get deployment zipkin

NAME     READY   UP-TO-DATE   AVAILABLE   AGE
zipkin   1/1     1            1           5m
Next, deploy the application using:
tye deploy -iTye will prompt for the zipkin URI. If you've followed these basic instructions, then use http://zipkin:9411.
💡 Your zipkin instance could be hosted anywhere - as long as you can provide a URI that makes it reachable to your pods.
Now to test it out!
Use kubectl to port forward to one of your services. This is what it looks like using the sample here.
> kubectl port-forward svc/frontend 5000:80This makes the frontend service accessible on port 5000 locally. Verify you can visit it in your browser successfully (http://localhost:5000).
After you've done a few requests, cancel this port forward using Ctrl+C. Now we'll port forward to zipkin:
> kubectl port-forward svc/zipkin 9411:9411💡 The ports are different here because zipkin usually listens on port 9411.
Now you should be able to visit your zipkin instance using http://localhost:9411. Just like before, after clicking the magnifying glass, you should see some traces.
Cleaning up deployment
To remove the deployed application run the following commands:
tye undeploy
kubectl delete -f https://github.com/dotnet/tye/blob/main/docs/recipes/zipkin.yaml
How this works
.NET Core 3.0 added a new suite of diagnostics tools as well as a runtime feature called EventPipe.
EventPipe allows another process to attach to your services and grab logs, metrics, and tracing data without any code in your application. Low level code in the runtime, http client, and web server is instrumented so that you can get diagnostics functionality without making code changes to your services.
When Tye runs your services locally, we attach to the EventPipe in each .NET service and listen for events and metrics. This powers the local zipkin experience: the Tye host listens to traces for all of your services and send them to zipkin.
For a deployed application, a few more steps are needed. At deployment time, we inject a sidecar container into your pods. We also make some changes to the pod definition so that our diagnostics sidecar can get access to your service's EventPipe.
You can see evidence of this if you look at the deployments that were created:
> kubectl get pods

NAME                        READY   STATUS    RESTARTS   AGE
backend-68974b7bfd-r59bn    2/2     Running   0          5m
frontend-7c94f75f98-zdqzf   2/2     Running   0          5m
zipkin-85bcf65bb4-pfxwz     1/1     Running   0          5m
Notice that there's 2/2 ready for these services, that means 2 out of 2 containers are ready - your service and the diagnostics sidecar.
Just like a normal container in Kubernetes, you can inspect the logs for the sidecar (written as a .NET worker).
info: Microsoft.Tye.DiagnosticsMonitor[0]
      dtrace: Using Zipkin at URL http://zipkin:9411/
info: Microsoft.Tye.DiagnosticsMonitor[0]
      Starting data collection
info: Microsoft.Hosting.Lifetime[0]
      Application started. Press Ctrl+C to shut down.
info: Microsoft.Hosting.Lifetime[0]
      Hosting environment: Production
info: Microsoft.Hosting.Lifetime[0]
      Content root path: /app
info: Microsoft.Tye.DiagnosticsMonitor[0]
      Selected process 7.
info: Microsoft.Tye.DiagnosticsMonitor[0]
      Listening for event pipe events for frontend-7c94f75f98-zdqzf on process id 7